Lower cost
Compare rates on your shipment profile, keep measured savings attached to the change, and track claims through recovery.
IronBenchmark · Savings ledger · IronClaims
IronAnalytics
IronAnalytics connects the first delivery to the second purchase, then puts parcel spend, carrier performance, savings, sourcing, claims, and tracking beside it.
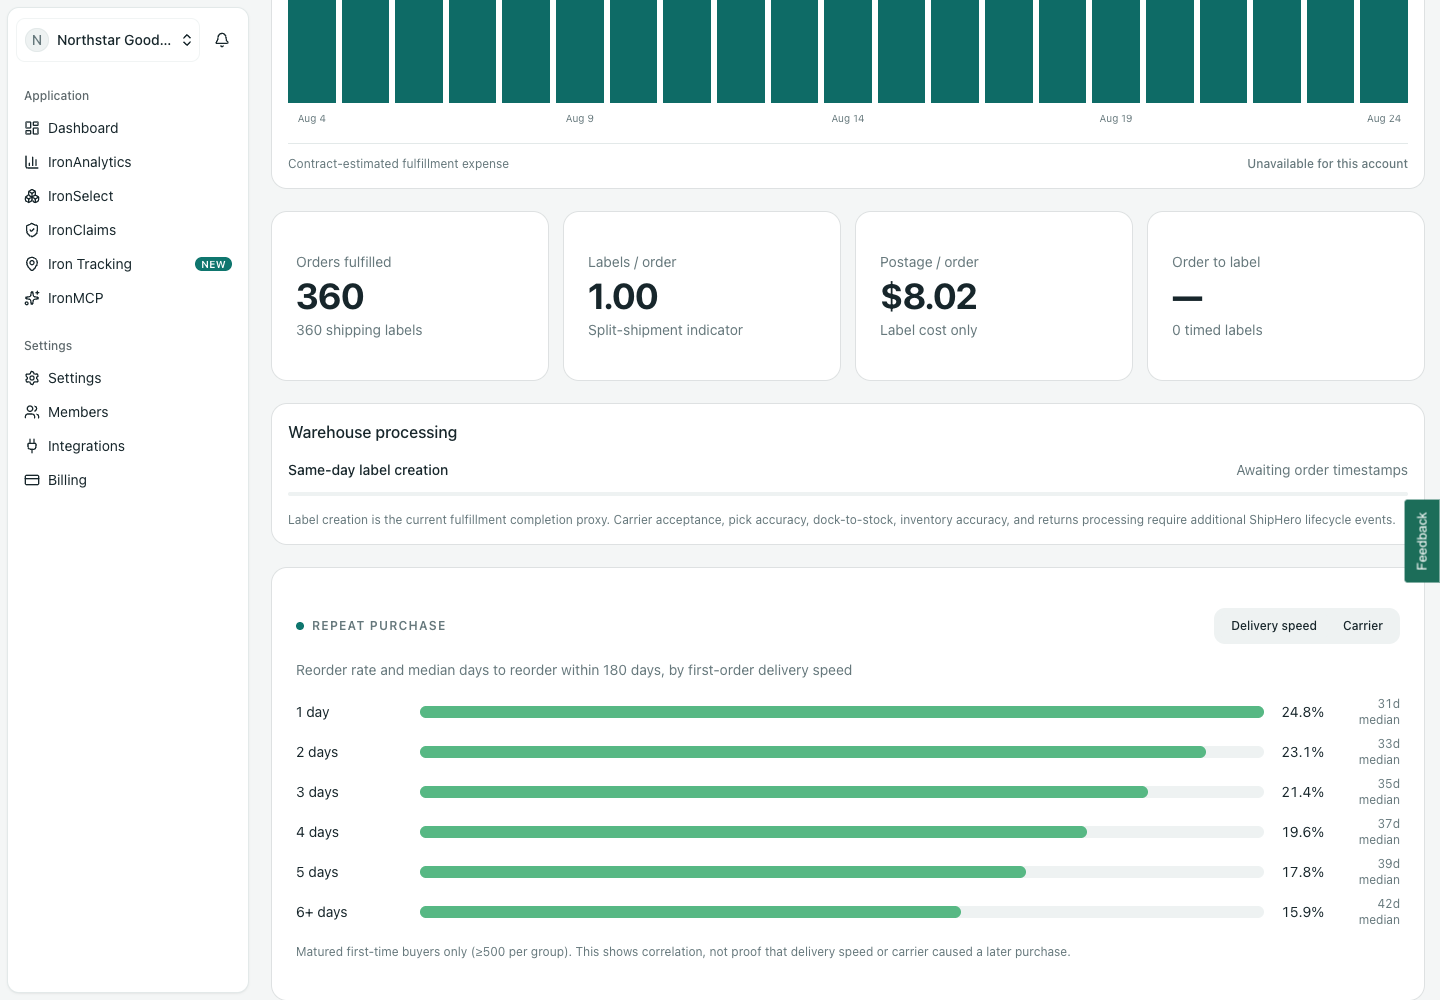
One-day delivery
24.8%
repeat purchase
Northstar Goods is a fictional demo workspace. All figures shown are synthetic.
24.8%
repeat at 1 day
15.9%
repeat at 6+ days
31 days
median reorder at 1 day
42 days
median reorder at 6+ days
IronAnalytics hero metric
A cheaper label is not cheaper if the delivery quietly costs the next order. IronAnalytics groups matured first-time buyers by their first delivery experience, then shows who reordered and how long it took.
The 8.9-point difference is a signal, not a causal claim.
Use it to decide where faster service deserves a test, then watch parcel cost and retention together.
The operating picture
Filter the entire account by date, carrier, channel, service, speed, zone, state, and weight. Export the same view when the decision leaves the screen.
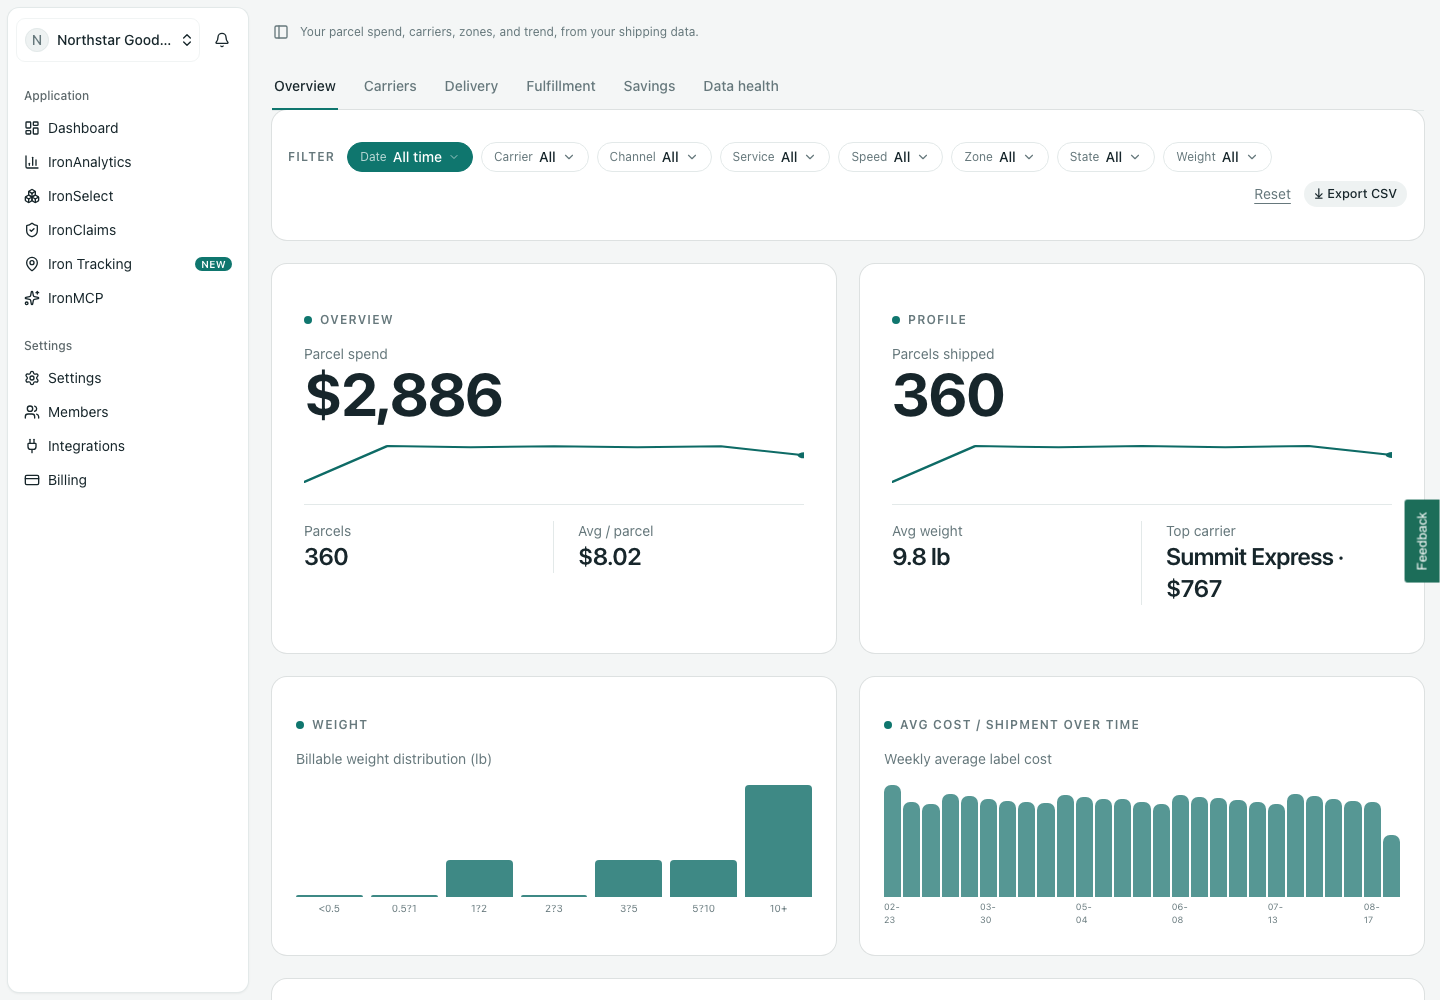
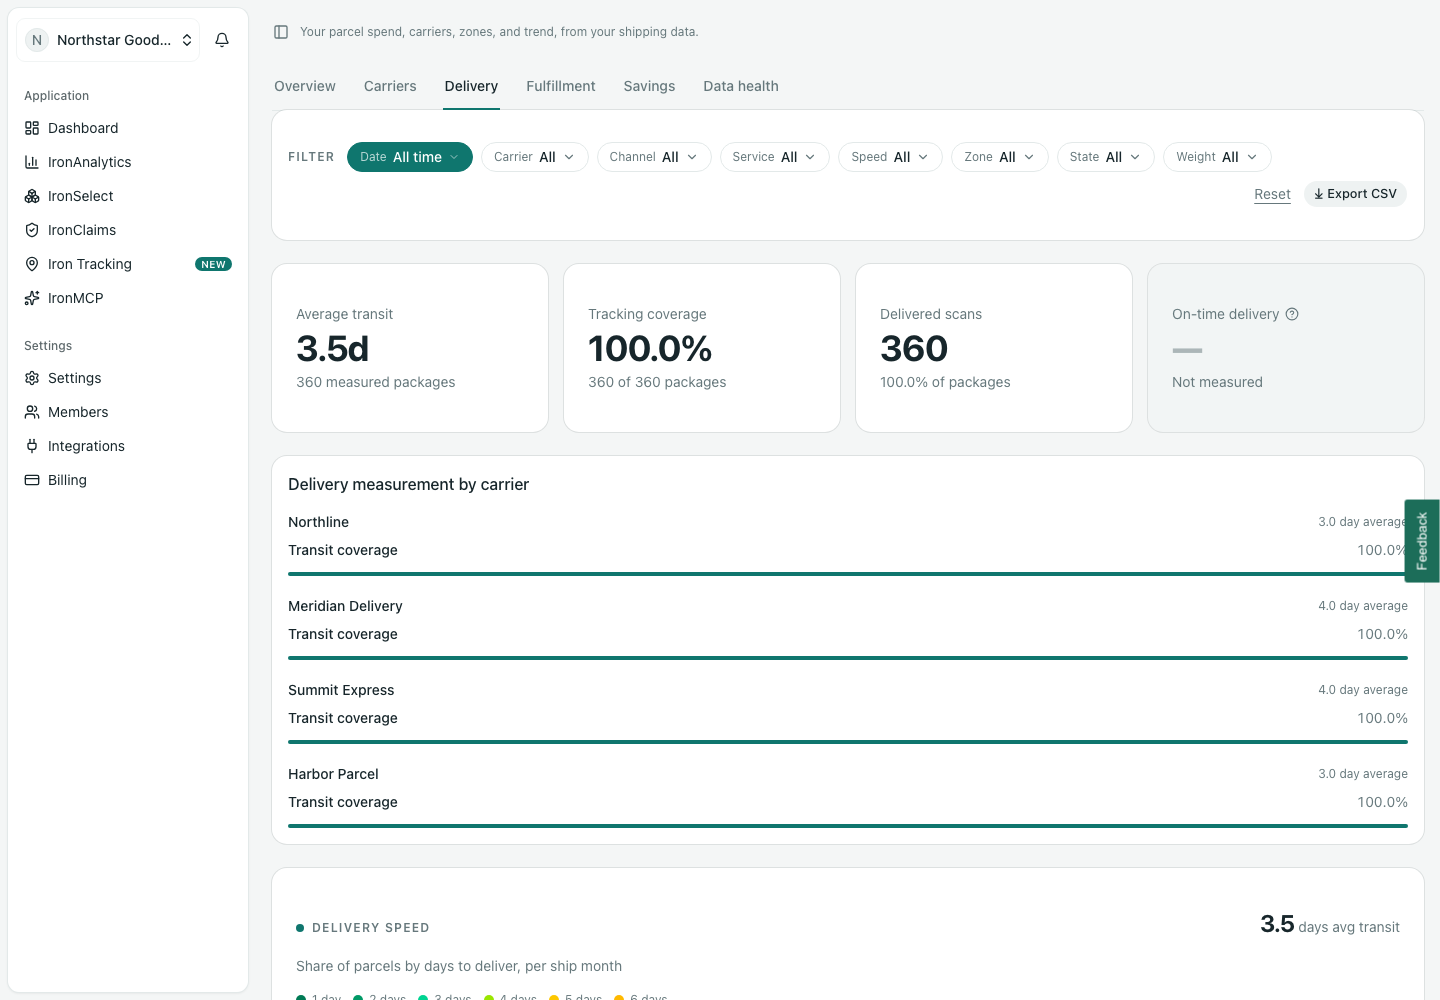
Screens show synthetic demo data. Your connected account replaces every figure.
What changes
Compare rates on your shipment profile, keep measured savings attached to the change, and track claims through recovery.
IronBenchmark · Savings ledger · IronClaims
Keep sourcing, bid comparisons, decisions, implementation, and follow-through in one operating record.
IronSelect · decision records · connected data
See parcel spend, delivery performance, repeat purchase, and post-purchase engagement together before changing the service.
IronAnalytics · Iron Tracking · exports
How it earns trust
Orders, shipments, labels, invoices, delivery events, fulfillment activity, claims, and tracking.
Compare carriers, services, speeds, cohorts, benchmarks, partners, and scenarios without changing the measurement surface.
Watch cost, delivery, repeat purchase, recovered dollars, and run-rate after the change goes live.
Questions
The view shows association, not proof of causation. Product, channel, promotion, and customer intent can also affect the result. We use the relationship to form a testable operating hypothesis.
A new customer has not had the full opportunity to reorder. IronAnalytics includes only first-time buyers old enough to complete the selected window, so recent acquisition does not dilute the rate.
IronAnalytics is the visibility and proof layer for the work we do together. Available modules depend on the engagement and the data connected to it.
No. Every screenshot and figure comes from Northstar Goods, our fictional demo workspace. A client portal uses that brand's own connected operating data.
Your numbers, not our demo
Bring one parcel question. We will show you where it lives in IronAnalytics and what data is needed to answer it.